Automated Burn Multiple & Rule of 40 Dashboard
Turning “MRR-only reporting” into real-time efficiency visibility for an anonymized Series A B2B SaaS company.
1 Executive Summary
The client was growing quickly (~15% MoM on paper) but lacked a real-time view of efficiency. Leadership could see revenue (MRR) but could not answer, week-to-week, whether hiring and go-to-market spend were improving Burn Multiple, CAC Payback, and the Rule of 40. We built an automated “Finance OS” that synced data across CRM, HRMS/Payroll, and ERP, then computed board-grade SaaS efficiency metrics in a single dashboard.
What changed after the build
- From lagging to leading: Efficiency metrics moved from month-end spreadsheets to a weekly operating view.
- From debate to decisions: Teams stopped arguing about “which number is right” and started acting on a single KPI layer.
- From vanity to sanity: MRR remained important, but efficiency became the constraint for scaling.
2 Business Context & The Real Problem
The founder knew their revenue but couldn’t see the unit economics that determine runway. Engineering and sales hiring was ramping, but “cost-to-serve” was rising faster than outcomes. The Rule of 40 went negative despite growth, signaling that scaling efficiency—not demand—was the core risk.
What the founder could see
- MRR/ARR and new bookings in CRM
- Basic P&L in accounting (lagging by weeks)
- Headcount counts in HRMS (not tied to outcomes)
What the founder could not see
- Real-time Burn Multiple (net burn vs net new ARR)
- CAC Payback by segment/channel
- Cost of talent flowing into cost-to-serve
- Rule of 40 and sales efficiency trendlines
Why it happened (root cause)
- CRM, payroll, and ERP each held partial truths
- No consistent mapping for segments, teams, or spend categories
- Manual spreadsheets broke as volume and hiring increased
What leadership needed weekly
- One KPI layer aligned to investor definitions
- A single dashboard view with drill-down by segment
- Runway impact of hiring and CAC payback shifts
3 The Finance-Tech Solution (3-Way Automated Sync)
Instead of waiting for manual spreadsheets, we built a lightweight, automated sync across three systems. Each system feeds a normalized model that produces consistent KPI outputs. This approach delivers usable visibility quickly—and improves accuracy as allocation rules mature.
CRM (HubSpot / Salesforce)
Pulls the revenue engine: pipeline, closed-won ARR/MRR, segment tags, owner attribution, and activity signals.
- New ARR / expansion ARR
- Segment and channel tagging
- Sales cycle and conversion rates
HRMS / Payroll (Deel / Payroll)
Pulls the cost of talent in real-time and keeps org mapping aligned as the company hires.
- Team-wise comp (Eng/CS/Sales/Marketing)
- Geo and role cost mix
- Headcount trend and ramp
ERP (Xero / QuickBooks)
Pulls overheads and vendor spend, categorized into finance-ready buckets.
- Cloud costs, tooling, contractors
- Professional services
- G&A + fixed overheads
KPI Model & Allocation Rules
Normalizes IDs/dates, applies mapping rules, computes Burn Multiple, Rule of 40, CAC Payback, LTV/CAC, Magic Number.
- Cost-to-serve attribution
- Segment rollups (SMB / Mid / Enterprise)
- Board-grade definitions and audit trail

4 KPI Layer (Definitions Used)
The KPI layer was designed to be “investor-aligned” and operationally usable. Each metric has a definition, inputs, and a consistent time window (monthly + rolling views).
| Metric | Operational Definition | Inputs (from systems) | Output View |
|---|---|---|---|
| Burn Multiple | Efficiency of growth: how much net burn is used to generate net new ARR. | Net cash burn (ERP + Payroll) + net new ARR (CRM) | Weekly + rolling 30/90 days |
| Rule of 40 | Growth + profitability balance score used in board/investor discussions. | Revenue growth % (CRM/ERP) + margin % (ERP) | Monthly snapshot + trend |
| CAC Payback | Months to recover acquisition costs using gross margin contribution. | S&M costs (Payroll + ERP) + GM% + new MRR (CRM) | Segment-by-segment view |
| LTV / CAC | Unit economics durability by segment/cohort. | Retention assumptions + ARPA + GM% + CAC (all systems) | Segment and cohort matrix |
| Magic Number | Sales efficiency: ARR growth generated per $ of Sales & Marketing spend. | ΔARR (CRM) and S&M spend (Payroll + ERP) | Trendline + threshold flags |
Design principle
- One metric dictionary: every KPI had a written definition and a single source of truth for inputs.
- Minimal debate: the KPI model handled normalization so stakeholders stopped reconciling spreadsheets.
- Actionable windows: weekly indicators for operating decisions, monthly for board reporting.
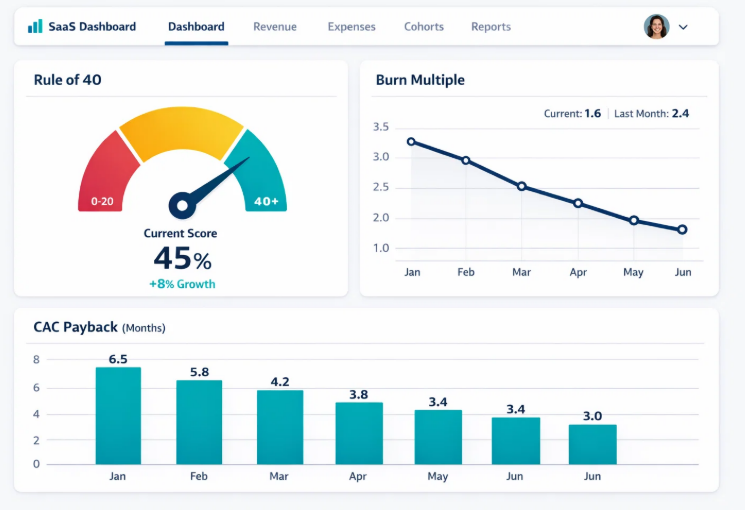
5 Dashboard Outputs (What Leadership Sees)
The dashboard was built to answer three recurring leadership questions: (1) Are we buying growth efficiently? (2) Which segments are improving payback? (3) What does hiring do to runway and Rule of 40?
Core panels included: Burn Multiple trend, Rule of 40 snapshot, CAC Payback by segment/channel, LTV/CAC by cohort, Magic Number trend, and a runway projection scenario view.
6 Implementation Approach (What We Built, Step-by-Step)
The build was delivered in a pragmatic sequence: connect sources, normalize data, encode allocation rules, compute KPIs, and ship a dashboard designed for weekly operating decisions and board reporting.
Step 1 — Connect data sources (CRM, Payroll, ERP)
Established automated extracts (API pulls or scheduled exports), aligned time zones and currency, and created stable identifiers for customers, segments, and cost centers.
Step 2 — Normalize & validate
Removed duplicates, standardized spend categories, validated revenue events (new vs expansion), and ensured the model reconciled to accounting totals.
Step 3 — Encode allocation rules
Implemented rules to attribute cost-to-serve and go-to-market spend to segments (e.g., payroll by team, overhead allocations by headcount/usage drivers). This is where the dashboard becomes “decision-grade.”
Step 4 — Compute KPIs & ship dashboard
Produced Burn Multiple, Rule of 40, CAC Payback, LTV/CAC, and Magic Number in a single view, with segment drill-down and PDF export layout for board packs.
Discovery & metric alignment
Defined KPI dictionary, time windows, segment taxonomy, and what “net burn” includes for leadership reporting.
System connections & baseline model
Connected CRM/Payroll/ERP and built baseline reconciliation so outputs matched finance totals.
Allocation rules & segment rollups
Implemented cost-to-serve and CAC attribution logic, and created segment/cohort views.
Dashboard rollout & operating rhythm
Shipped weekly KPI review cadence, exceptions (payback worsening), and board-ready PDF export format.
7 Data Model & Allocation Logic (Ground-Level Details)
Below is the “how” behind the dashboard. This is the part that makes the outputs credible: mapping costs to the way the business actually operates, not just to accounting line items.
CAC Construction
- S&M payroll (Sales + Marketing) from HRMS
- Tools/spend (ads, intent data, agencies) from ERP
- Optional: sales time allocation by segment (CRM ownership/activity)
Cost-to-Serve Construction
- Engineering + CS payroll mapped by team
- Cloud/infrastructure and support tooling from ERP
- Allocated to segments via headcount drivers or usage tagging
Net Burn Definition
- Operating outflows (payroll + overheads)
- Less inflows (gross margin contribution)
- Consistent window (monthly + rolling)
Net New ARR Definition
- New ARR + expansion ARR from CRM
- Less churn/contraction (if tracked)
- Segment and channel tagging retained for drill-down
8 Results & Impact (Anonymized)
The most important outcome was decision velocity and clarity. Leadership could see whether efficiency was improving, which segments were healthy, and what hiring did to runway—without waiting for month-end.
Observed outcomes from the new operating view
- Efficiency became measurable: Burn Multiple and CAC Payback were tracked weekly, not monthly.
- Segment clarity: LTV/CAC and payback were visible by customer segment, highlighting where growth was fragile.
- Hiring discipline: Talent cost was connected to cost-to-serve, enabling more confident hiring sequencing.
- Board communication: A consistent KPI narrative reduced friction in investor/board conversations.
Important note: If you cannot disclose client values, keep the dashboard visuals illustrative while maintaining the exact structure and methodology.
Suggested disclosure format: “Values are anonymized/illustrative; method and build reflect a real engagement.”
9 Recommendations (For SaaS Founders Reading This)
If your team is scaling headcount or spend, these are the practical steps to ensure growth is efficient—before the board forces the conversation.
1Stop running on MRR alone
MRR is a leading indicator of demand, not efficiency. Add Burn Multiple and CAC Payback to your weekly operating rhythm.
2Connect payroll to outcomes
If you can’t tie cost of talent to segments and cost-to-serve, you can’t tell whether hiring is improving or hurting runway.
3Use one KPI dictionary
Write definitions once (what’s included, time windows, segment logic). Consistency beats debate.
4Make the dashboard printable
Design for board packs: one page that summarizes growth, efficiency, and runway with a narrative summary.
10 Deliverables Produced
This engagement was delivered as a complete “Finance OS” package: automation, KPI logic, and a reporting view that supports weekly operations and board discussions.
Automation Layer
- Scheduled extracts from CRM, HRMS/Payroll, ERP
- Normalization + dedup + reconciliation checks
- Logging and data quality flags
KPI Model
- Burn Multiple, Rule of 40, CAC Payback, LTV/CAC, Magic Number
- Segment and cohort rollups
- Metric dictionary + assumptions sheet
Dashboard View
- Executive KPI heartbeat
- Segment drill-down and threshold flags
- PDF-friendly board export layout
Operating Rhythm
- Weekly review agenda and owner actions
- Exception tracking (payback, burn spikes)
- Governance notes and change log for rules